Earth Drones in
Environmental Analysis & Conservation
Earth drones specializes in environmental monitoring and analysis using drones as tools to collect valuable high resolution image data we then process and analyze in specialized software.
Whether bad or good, the world around us is changing rapidly, By using Unmanned Aerial Vehicles (UAVs), Earth Drones can analyze the environment quicker and more accurately than ever before which in turn allows for faster management decisions that ultimately benefit conservation practices and in turn the environment.
Georeferenced Orthomosaic Maps
Earth Drones can provide georeferenced orthomosaic maps that can be loaded into Google Earth or used in GIS for data extraction and analysis. Ortho maps are not only powerful visual aids and can be used for taking accurate measurements of the environment down to 1cm in reality. Vegetation health data can also be extracted with ease by using indices and the numeric data compiled into Excel documents for further analysis and data crunching.
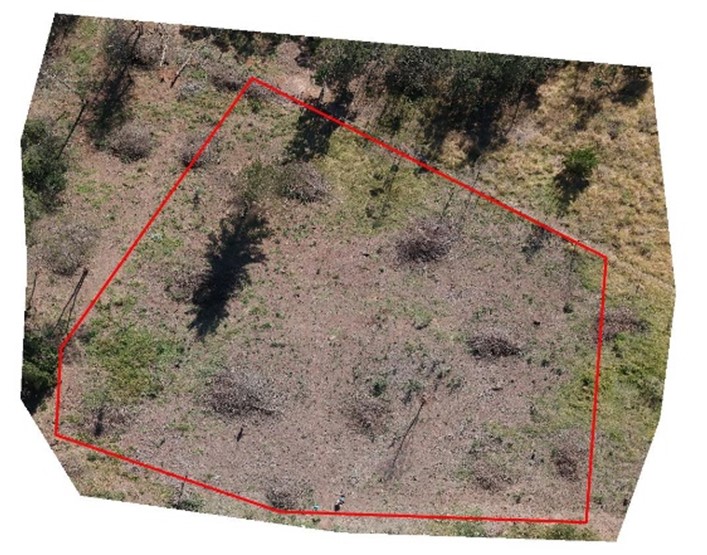
Fig 1A
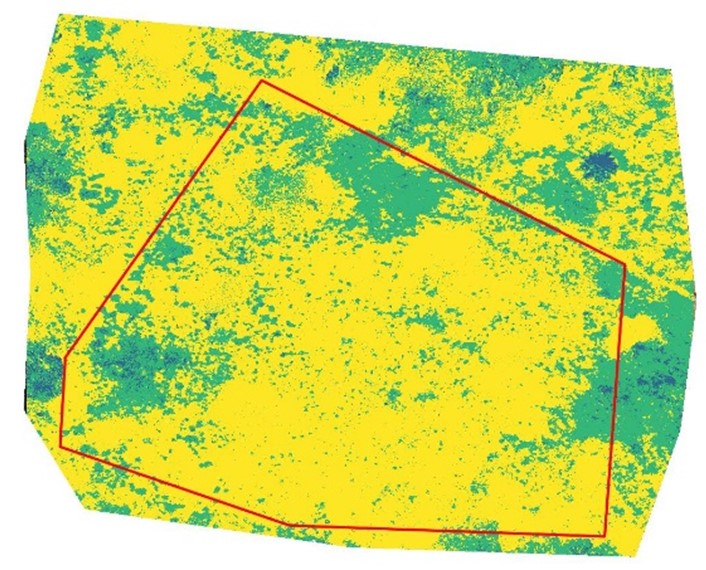
Fig 1B
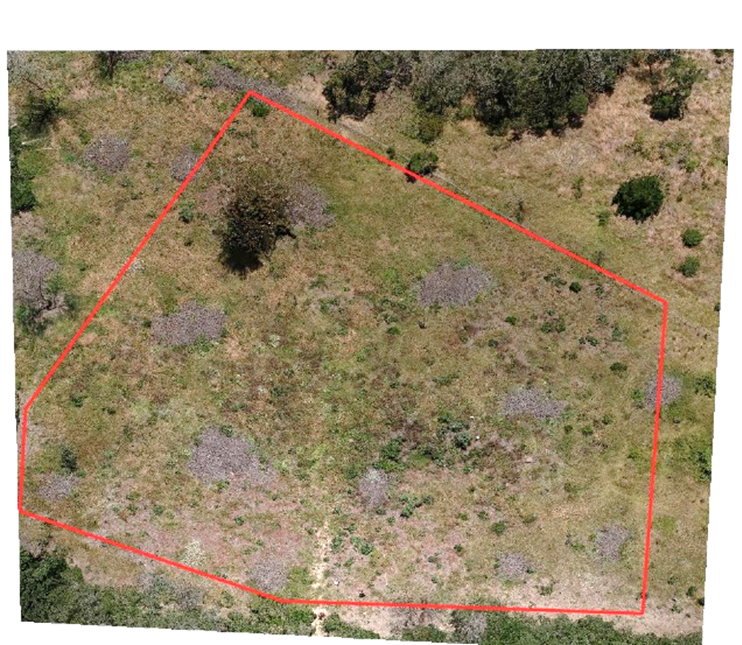
Fig 2A
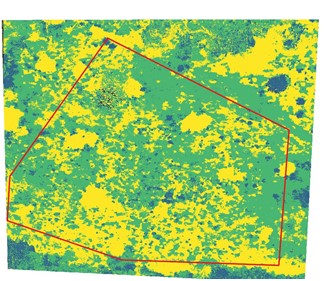
Fig 2B
Above: Alien vegetation clearing and recovery monitoring. The above ortho maps show an area (red border) of Black Wattle (Acacia mearnsii) that was cleared by conservationists leaving exposed soil underneath (fig 1A). By using specialized software and calculations, numerical data can be extracted in the form of indices manipulation (fig 2A) showing just how much area has been cleared and what remaining vegetation is left (green) and how much soil is exposed (yellow). Six months later the after-rehabilitation measure was put in place, much of the natural vegetation had recovered (fig 2A and fig 2B). The numeric data was then extracted, calculated and tabulated to show recovery related to area (m2) and percentage recovery.
Digital elevation (DEM) and digital surface model (DSM)
These maps are, like the orthomosaic maps, georeferenced and can therefore be overlayed into Google Earth or used in GIS software for terrain and environmental data analysis. These maps allow the observer to extract x, y and z axis information which is very useful for understanding erosion, calculating canopy volume or understanding gradients for example.
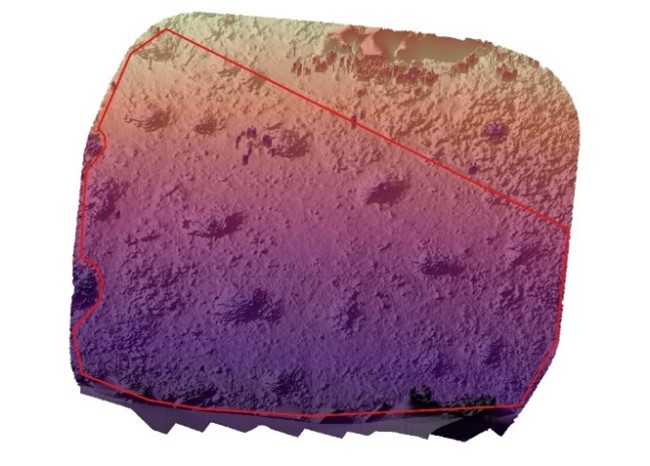
DEM of the aforementioned plot just after it was cleared of Acacia mearnsii the stock piled woody material is now clearly visible. Note the slope gradient as well, dark area represents the upper slope and the yellow the lower. Contours can be mapped out using DEM, DSM maps for further understanding of the environment. Earth Drones can extract a large amount of data from these maps including volume, canopy heights and more. DEMs are also great for urban planning and monitoring.
3D point clouds
Pont clouds allow the observer to analyze the environment in 3 dimensions with incredible accuracy. These files can be used in programs such as AutoCAD and other engineering software. Point clouds are extremely powerful when it comes to extracting height information from landscapes, urban environments, forests and more. Earth Drones is able to compute and visualise height data for all environments.
The aforementioned area showing the height data for the native plant species that have recovered after alien vegetation removal was complete. Scale bar on the right illustrates heights in meters.
A side profile of the landscape showing tree heights as well as the gradient of the slope.
Point clouds are also extremely useful for change detection within the environment. When monitoring community expansion and development, new structures and features can be determined quickly over time. Erosion and deposition can be detected on sodic sites, water courses, urban or damage lands. Areas of tree growth or removal can also be quickly ascertained.
The above image shows the change in the aforementioned site after 14 months. It is clear to see that there is a lot of new growth (red) and also some reduction (blue) The most obvious reduction is the breakdown of the woody material stock piles circled in green. This is due to decomposition of the biomaterial over time. Other areas of reduction in the tree line are due to seasonal change where leave have fallen off (the two datasets that were compared were at different times of the year). Scale bar in meters.
3D MODELS
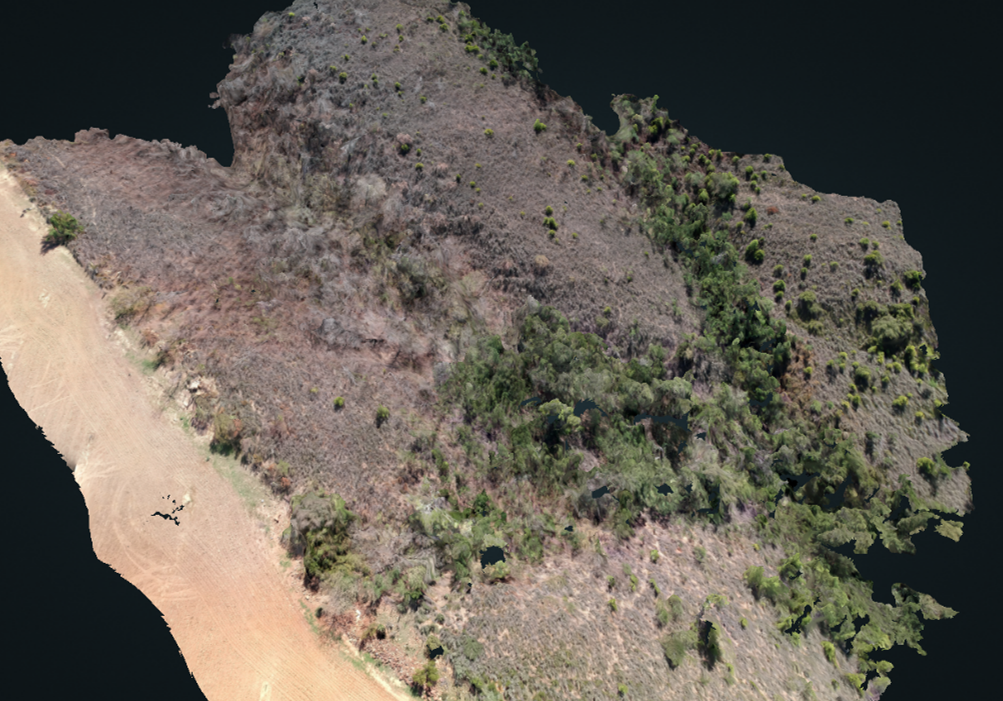
Large areas can be digitized in 3D such as this tributary with is currently being cleared of alien vegetation and being monitored of and changes that may occur.
3D models are a wonderful way to navigate through a landscape or environment. Large areas can be digitized and sent anywhere in the world allowing observers to visualize an environment with ease. This is a powerful way to revisit landscapes, look for differences and understand terrain for example.
Multispectral
In order to properly analyze the health of vegetation in the environment, a multispectral option is available. Multispectral drone data incorporates individual Red, Green and Blue light bands as well a Near Infrared (NIR) and Red Edge. Chlorophyll in plants reflects highly in the near infrared spectrum which humans cannot see with the naked eye. Red edge is a very specific light band between near infrared and red and therefore adds “fine tuning” to the data set. The healthier the plant, the more stable the cell walls and the more chlorophyll there is and therefore the more reflectance will be detected by the drone’s sensor. Maps are then generated from the data and numeric information related to plant health can then be determined. This allows for the observer to rapidly detect areas of noticeable plant health variations and even give insight as to where plants may start to struggle in the future.
A side profile of the landscape showing tree heights as well as the gradient of the slope.
A visual representation of how light reflectance works in relation to plant health
An example of how multispectral data can be used in forestry to detect insect infestation and the affect they are having on the trees.